Information about Nutanix Kubernetes Platform (Part 9 of many)
NKP comes with a pre-configured logging stack that allows you to collect and visualize pod and admin log data at the workspace level. The logging stack is also multi-tenant capable, and multi-tenancy is enabled at the project level through role-based access control (RBAC).
By default, logging stack applications are disabled on managed and attached clusters. You need to explicitly enable them on a workspace to use their capabilities.
Architecture of logging within NKP
A few Platform Applications are the primary components of the logging stack:
- BanzaiCloud Logging-operator.
- Grafana and Grafana Loki.
- Fluent Bit and Fluentd.
In addition to these platform services, logging relies on other software and system facilities, including the container runtime, the journal facility, and system configuration to collect logs and messages from all the machines in the cluster.
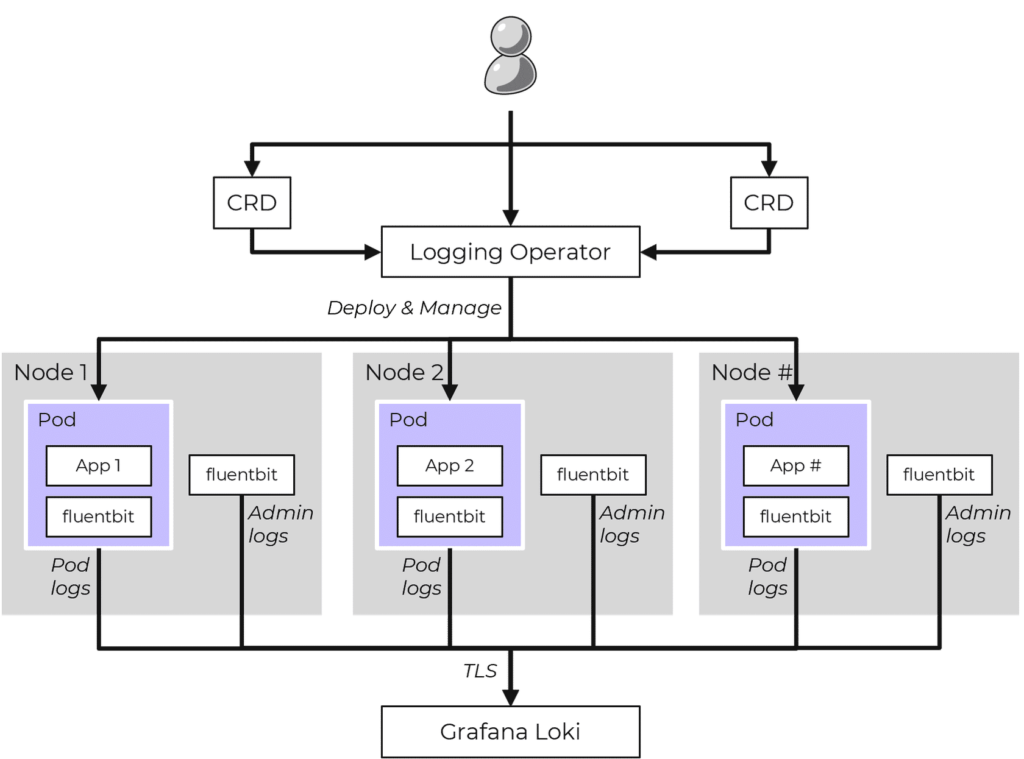
The NKP logging stack aggregates logs from applications and nodes running inside your cluster. NKP uses the BanzaiCloud Logging Operator to manage the Fluent Bit and Fluentd deployments that collect pod logs using Kubernetes API extensions called custom resources. Custom resources allow users to declare logging configurations using kubectl commands.
The Fluent Bit instance deployed by the Logging Operator gathers pod logs data and sends it to Fluentd, which forwards it to the appropriate Grafana Loki servers based on the configuration defined in custom resources.
Grafana Loki then indexes the log data by label and stores it for querying. Loki maintains log order integrity but does not index the log messages themselves, which improves its efficiency and lowers its footprint.
Enabling the logging stack
When enabling the logging stack, the applications Logging Operator, Grafana Logging, Grafana Loki as well as Fluent Bit are beging enabled an all clusters managed by the Management Clusters.
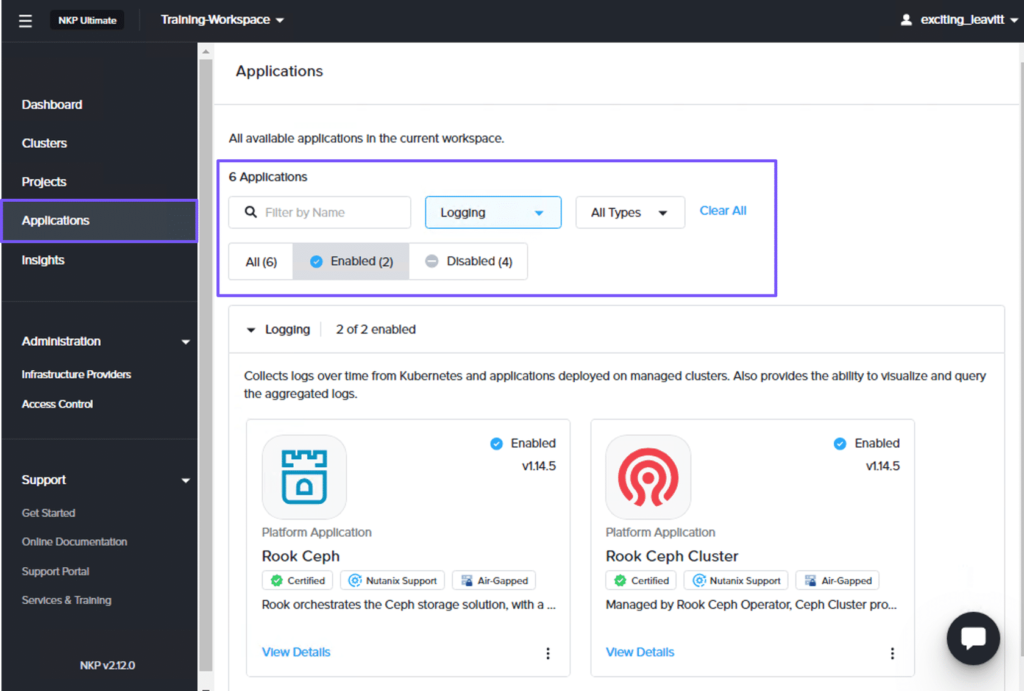
On the workspace dashboard, select Applications from the left pane. On the Applications page, select Logging from the All Categories drop-down menu and click Enabled. Two logging applications, Rook Ceph and Rook Ceph Cluster, are enabled in the workspace, as shown in the figure below.
To enable the other logging applications: Logging Operator, Grafana Loki, Grafana Logging, and Fluent Bit.
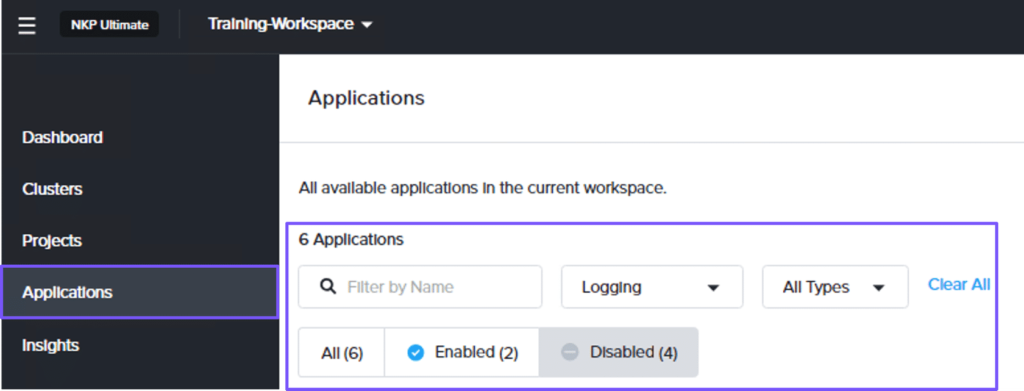
In the workspace dashboard, select Applications from the left pane. On the Applications page, select Logging from the All Categories drop-down menu and click Disabled.
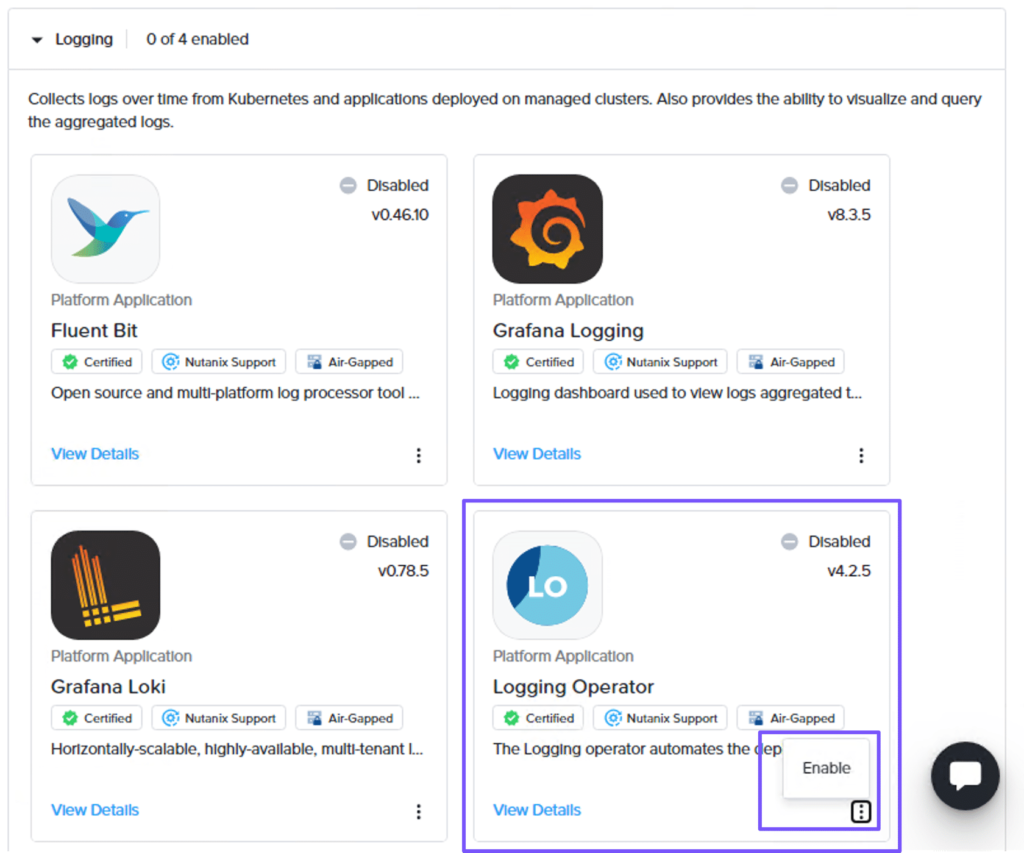
In the Logging category, click the ellipses for the Logging Operator widget and click Enable.
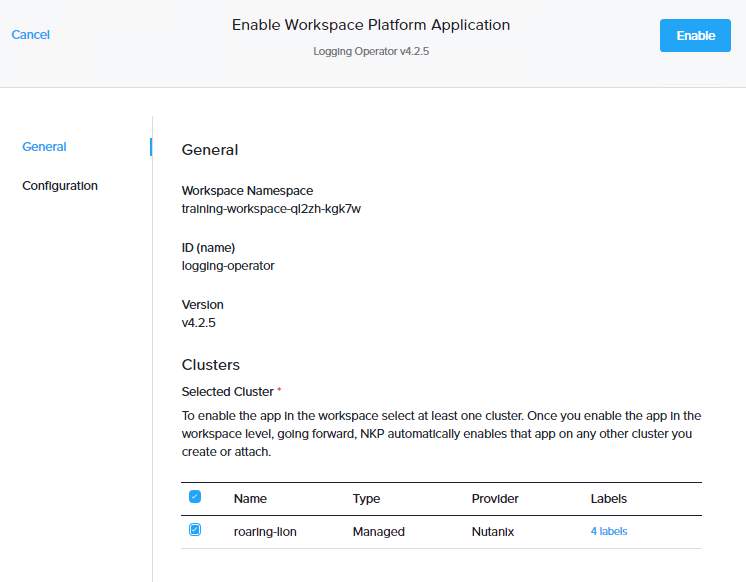
On the Enable Workspace Platform Application page, in the General step, select the cluster in the Clusters section to enable the app in the workspace. Enabling an app at the workspace level will automatically enable it on other clusters created or attached to this workspace in the future.
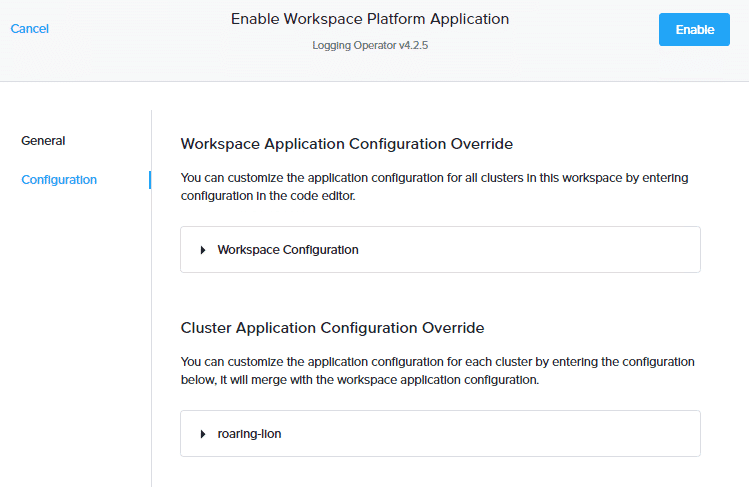
In the Configuration step, you can customize the application configuration individually for each cluster or at once for all clusters in this workspace. In this example, we will leave the default settings and click Enable.
Now that Logging Operator application has been enabled, you can repeat the same steps to enable Grafana Loki, Grafana Logging, and Fluent Bit logging applications.
Note that Grafana applications have dependencies.
- Grafana Logging has a dependency on Grafana Loki.
- Grafana Loki has a dependency on Rook Ceph Cluster.
Therefore, enable the logging applications in the following order:
- Rook Ceph Cluster
- Grafana Loki
- Grafana Logging
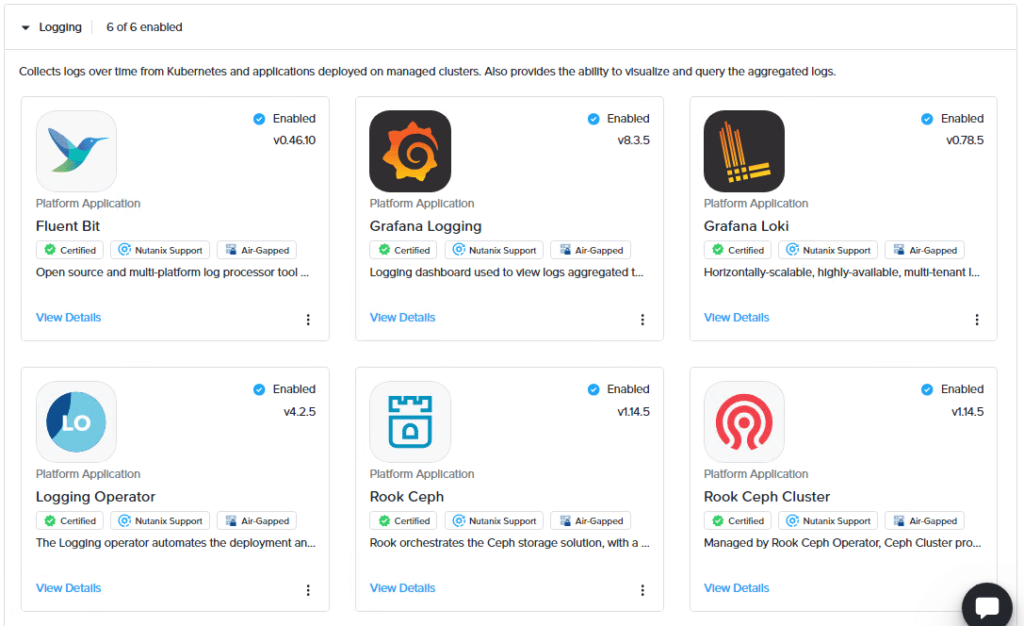
Now that we have enabled our Logging platform applications, they will appear on the Applications page as shown below.
Verify the Logging stack installation by CLI
You can check if the logging stack has been installed successfully. It should be installed succesfully, before you can attempt to configure the logging features.
You can use the following commands on the management cluster.
| command | Comments |
|---|---|
| nkp get workspaces | Copy the value under the NAMESPACE column for your workspace. |
| export WORKSPACE_NAMESPACE=<WORKSPACE_NAMESPACE> | Set the WORKSPACE_NAMESPACE variable to the namespace copied in the previous step. |
| kubectl get helmreleases -n ${WORKSPACE_NAMESPACE} | Run this commands on the managed or attached cluster. Ensure you switch to the correct context or kubeconfig of the attached cluster for the following kubectl commands. |
When the logging stack is successfully deployed, you will see output that includes the following HelmReleases.
NAME                         READY   STATUS                             AGE
grafana-logging              True    Release reconciliation succeeded   15m
logging-operator             True    Release reconciliation succeeded   15m
logging-operator-logging     True    Release reconciliation succeeded   15m
grafana-loki                 True    Release reconciliation succeeded   15m
rook-ceph                    True    Release reconciliation succeeded   15m
rook-ceph-cluster            True    Release reconciliation succeeded   15m
object-bucket-claims         True    Release reconciliation succeeded   15m
Customizing the logging stack
The default logging stack settings can be customized based on your requirements and the application workloads running on your clusters. I will give you some suggestions for logging stack customizations. Nutanix has some recommendations for the sizing of the logging stack applications. You can find them here.
Logging Operator
In a high log traffic environment, fluentd usually becomes the bottleneck of the logging stack. The typical sign of this is when fluentd cannot handle its buffer directory size growth for more than the configured or calculated flush interval. In this case, you can scale fluentd statefulset.
You can also improve Fluentd throughput by turning off the buffering for loki cluster output.
Grafana Loki
NKP deploys Loki in Microservice mode. This provides you with the highest flexibility in terms of scaling. In a high log traffic environment, Nutanix recommends:
- Ingester should be the first component to be considered for scaling up.
- Distributor should be scaled up only when the existing Distributor is experiencing stress due to high computing resource usage.
- Usually, the number of Distributor pods should be much lower than the number of Ingester pods.
Rook Ceph
Ceph is the default S3 compatible storage. In NKP, a Rook Ceph Operator and a Rook Ceph Cluster are deployed together to form a Ceph Cluster.
The default configuration of Rook Ceph Cluster in NKP has a 33% overhead in data storage for redundancy. Meaning, if the data disks allocated for your Rook Ceph Cluster are 1000Gb, 750Gb will be used to store your data. Remember to account for this when planning the capacity of your data disks.
ObjectBucketClaim has a storage limit option to prevent your storage from growing too large. In NKP this is enabled by default.
So, after you scale up your Rook Ceph Cluster for more storage, it is important to also increase the storage limit of ObjectBucketClaims of your grafana-loki and/or project-grafana-loki.
Ceph OSD CPU considerations
Ceph OSD is the object storage daemon for the Ceph distributed file system. It is responsible for storing objects on a local file system and providing access to them over the network.
If you determine that Ceph OSD is the bottleneck, then you may wish to consider increasing the CPU allocated to it.
Grafana UI
If the Prometheus Monitoring (kube-prometheus-stack) platform application is enabled in NKP, you can view the Logging Operator dashboard in the Grafana UI. This is also true for the Loki and Ceph dashboards.
Audit Log
Enabling the audit log requires additional compute and storage resources. When you enable audit log by enabling Fluent Bit, inbound traffic to the logging stack increases the log traffic by approximately 3-4 times.
So, when enabling the audit log, consider scaling up all logging stack components mentioned above.
It is also an option to just collect a subset of the logs that the default config makes the Fluent Bit kommander-fluent-bit pods collect. Then you can add your own override configmap to kommander-fluent-bit with proper Fluent Bit INPUT, FILTER, and OUTPUT settings. This helps reduce the audit log traffic. See for more information the Fluent Bit documentation
Viewing Cluster Log Data
Log data is always viewed at the cluster level using the Grafana logging URL for the cluster.
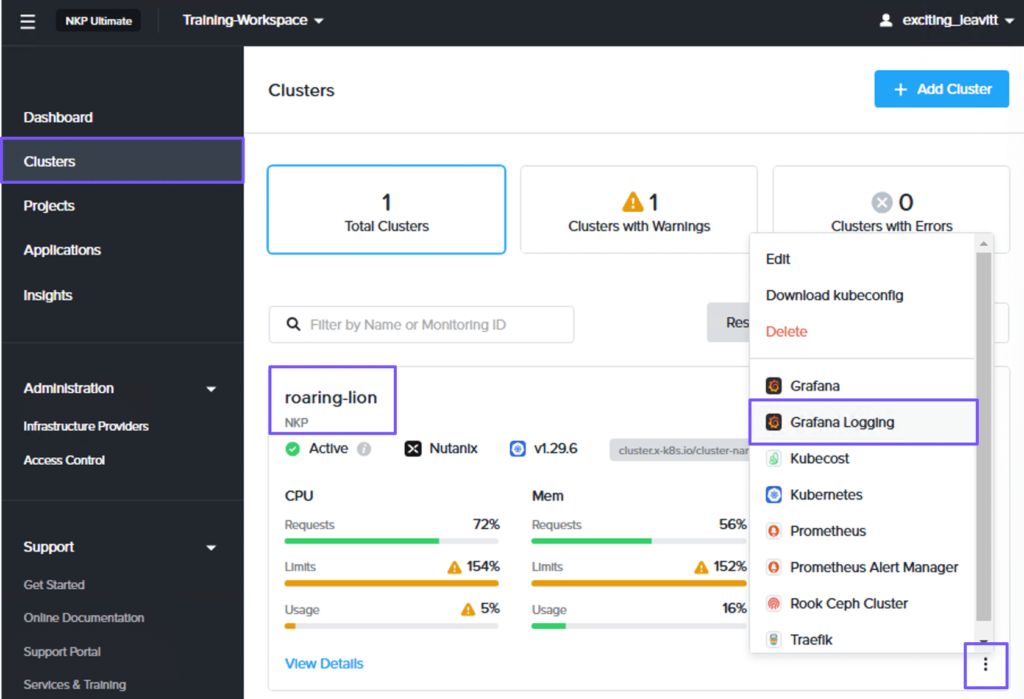
On the workspace dashboard, select Clusters from the left pane. On the Clusters page, click the ellipsis for the cluster and select Grafana Logging.
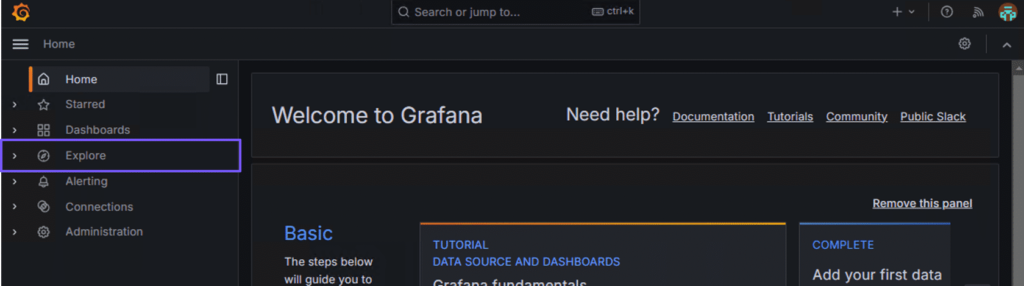
Then, log in to the Grafana Logging dashboard using NKP UI credentials and then select Explore from the navigation pane on the left.
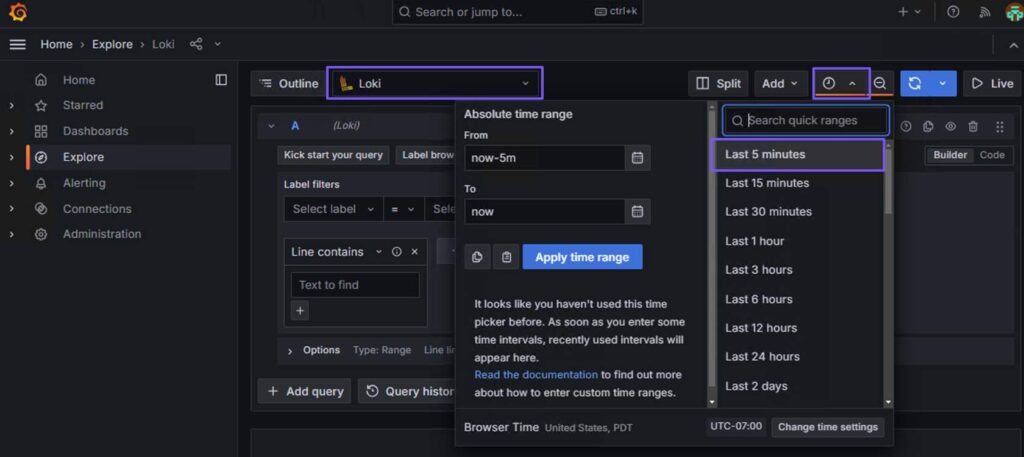
On the Explore page, you can select a data source, create an outline, split the pane, add logs to the dashboard, select a time, and run queries. In this example, we will run a query to view the logs in the cluster.
To do this, select Loki as the data source, click the Time Picker (clock) icon, and select the Last 5 minutes predefined time. This will display logs captured in the last five minutes. You can also enter an absolute time range.
You can construct a basic query to fetch all logs for the sockshop (project) namespace in the cluster.
In the query editor, select namespace from the Label filters drop-down list, sockshop from the Value drop-down list, and click Run Query to fetch all logs.
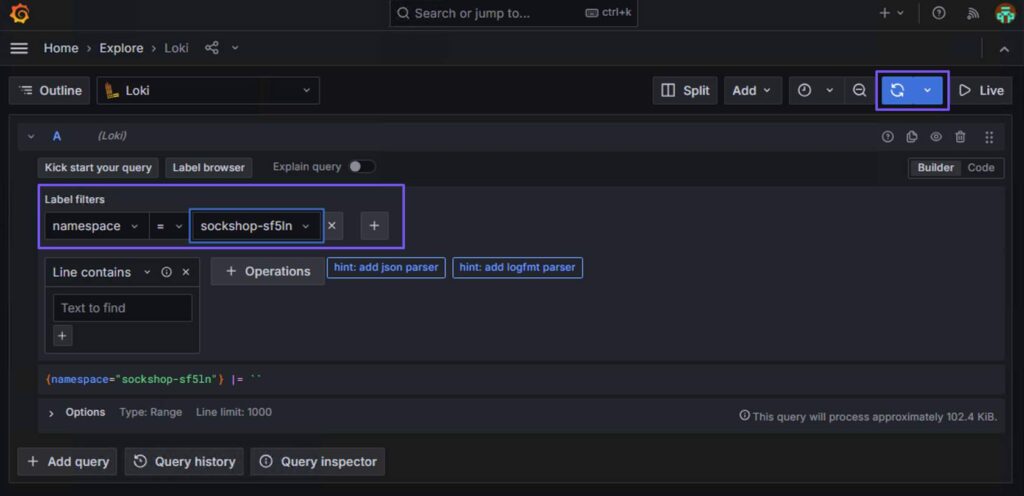
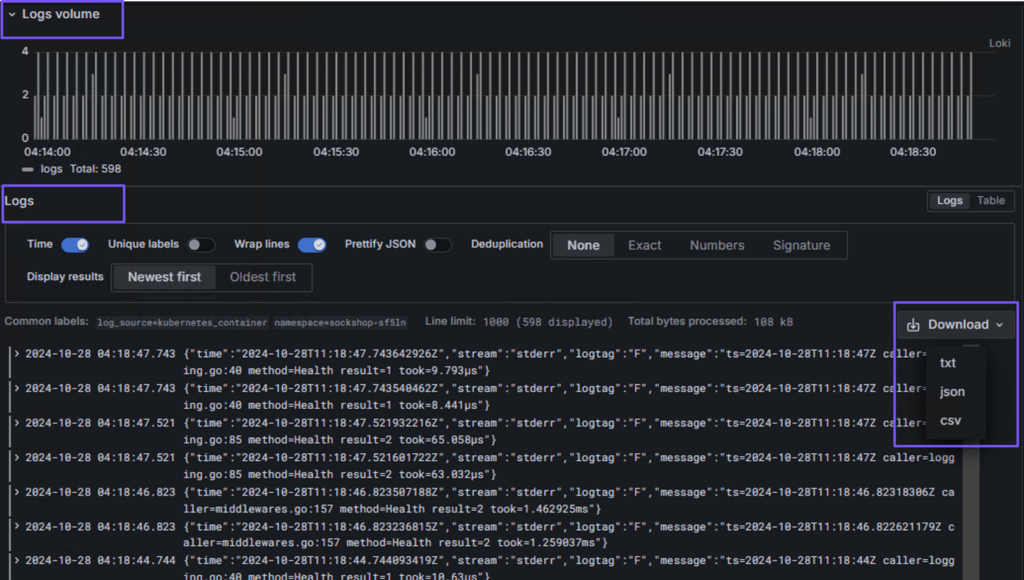
The query editor will display the Logs volume and Logs sections. The Logs volume section displays a graph showing the log distribution for submitted log queries, and the Logs section displays log messages.
Admin-level logs
NKP includes a Fluent Bit instance to collect the admin-level logging information. This is sent to the workspace Grafana Loki that is running on the cluster. So you have to option to isolate sensitive logs from the Logging Operator.
Admin logs include:
- Logs for host processes managed by systemd
- Kernel logs
- Kubernetes audit logs
By default, Fluent Bit is disabled on the management cluster. The amount of admin logs ingested to Loki requires additional disk space to be configured on the rook-ceph-cluster. Enabling admin logs might take around 2GB/day per node.
Leave a Reply